


Koichi Saruta, Toshihiko Yamaguchi, and Masashi Ueda
Japan Atomic Energy Agency, 1 Shiraki, Tsuruga, Fukui 919-1279, Japan
Vol.7, No.4, NT75
Effects of metallic diaphragms on sensitivity characteristics of an optical ultrasonic sensor and reduction of interrogation time based on wavelength division multiplexing for under-sodium visual inspection
KEYWORDS:
Optical ultrasonic sensor, Optical pressure sensor, Under-sodium viewer, Fast reactor
1. Technical summary
Classification
1 - A Inspection
In sodium-cooled fast reactors, visual inspection of the structural components that are immersed in molten sodium will be carried out by means of ultrasonic imaging techniques since the opacity of the liquid-metal coolant makes it impossible to use standard visual instruments such as charge-coupled-device cameras, which have been widely applied to visual inspection in light water reactors. Figure 1 shows a schematic of under-sodium visual inspection in the reactor vessel [1]. To examine the core internals, an ultrasonic sensor array and piezoelectric transducers are mounted on a vehicle that can move through the sodium coolant. Each of the transducers serially emits an ultrasonic pulse, and the sensor array receives the reflected pulses from flaws or loose parts in an inspection area. Image reconstruction is conducted based on time-of-flight measurements of the reflected pulses on a computer placed outside the reactor vessel. The sensor array is built by arranging a number of ultrasonic sensing elements in a matrix form. Piezoelectric and optical ultrasonic sensors are both able to be used as the sensing elements [1-4], though the optical methods have advantages over the piezoelectric methods such as immunity to electromagnetic interference, low transmission loss, high heat resistance, small dimensions, and high multiplexing capability.
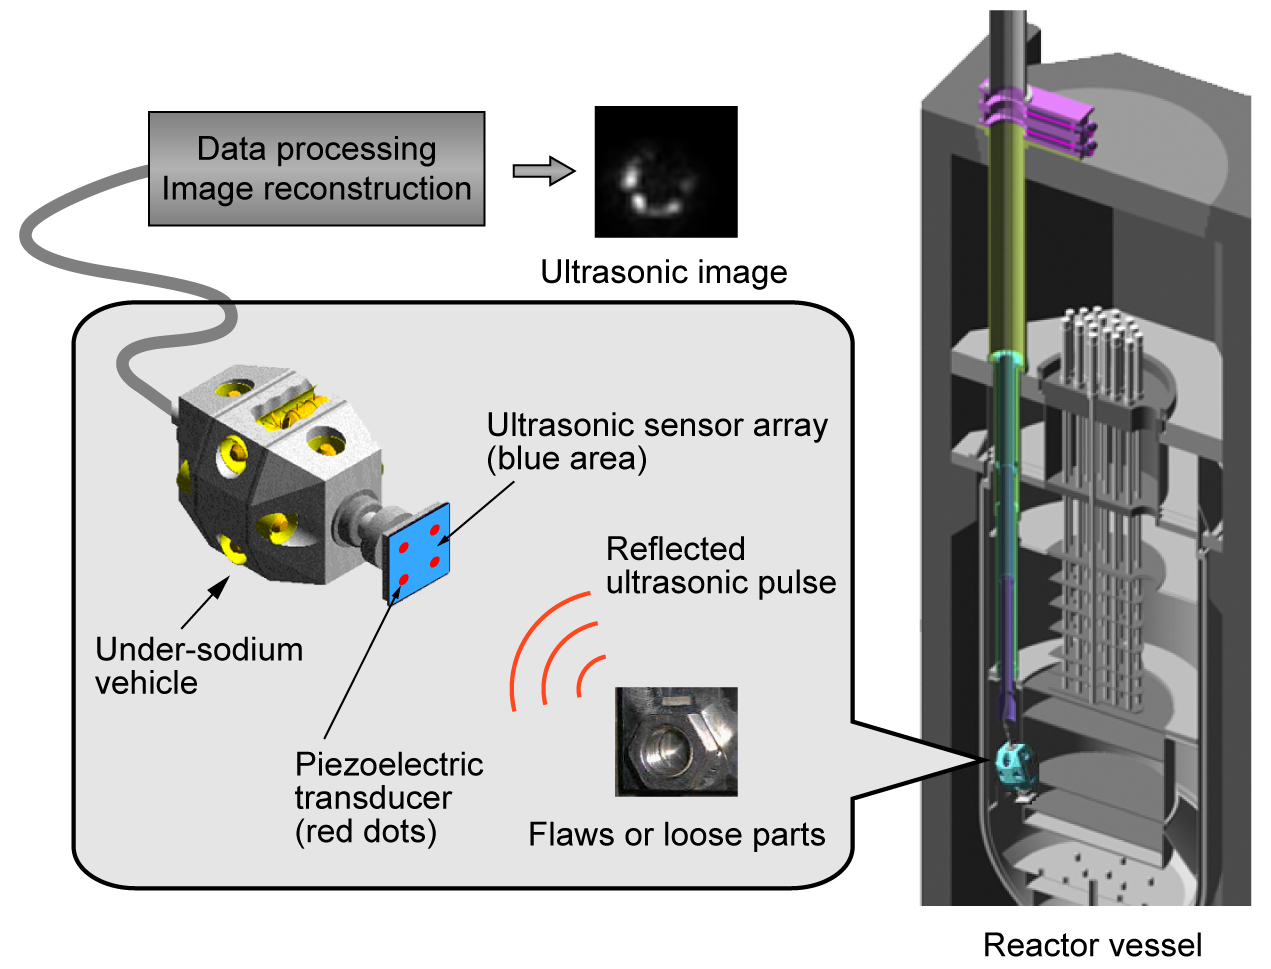
Fig.1. Schematic of under-sodium visual inspection in the reactor vessel.
As schematically illustrated in Fig. 2, an optical ultrasonic sensor basically consists of a metallic diaphragm and a laser interferometer [5]. The diaphragm vibrates in response to an ultrasonic wave, which then causes a frequency modulation of the laser beam reflected on the diaphragm due to the Doppler effect. Consequently, the ultrasonic wave incident on the diaphragm is detected by the laser interferometer as a frequency shift of the reflected light. In previous studies [1, 2], a confocal Fabry-Perot interferometer was employed to interrogate a two-dimensional array of diaphragms. Individual diaphragms are sequentially accessed by shifting an optical fiber to each diaphragm using a 1 x N optical switch. According to a calculation in the case of a 100 x 100 arrayed sensor [1], it takes more than 4 hours to interrogate all the diaphragms in the array. Such long interrogation time not only prolongs the inspection but also can degrade the resultant image quality because the sodium temperature in an inspection area is likely to change during the interrogation of the sensor array. Furthermore, relatively low sensitivities of optical sensors need signal averaging and in turn increase the interrogation time. In fact, more than 500 measurements were averaged for each diaphragm to produce a single ultrasonic image with a signal to noise ratio required for visual inspection [1]. An improvement in the sensitivity and a reduction of the interrogation time are, therefore, key issues in the development of an under-sodium visual inspection technique using optical ultrasonic sensors. Since the diaphragm functions as a transducer, the property of the diaphragm has a great influence on the sensitivity. The multiplexed measurement of the diaphragms is a crucial factor to shorten the interrogation time.The present work is intended to experimentally examine the effects of metallic diaphragms on the sensitivity characteristics of an optical ultrasonic sensor and explore the feasibility of a reduction of the interrogation time based on wavelength division multiplexing (WDM) technique. In these experiments, we have employed a heterodyne interferometer in order to conduct the multiplexed measurement of the diaphragms based on WDM technique. We first describe the waves induced on stainless steel (SUS304) diaphragms in response to an incident ultrasonic wave. The waveforms observed on a variety of diaphragms are then compared as to the amplitude as a function of applied acoustic pressure in order to examine the effects of the diameter, thickness, and material of those diaphragms on the sensitivity. Finally, preliminary results obtained from the multiplexed measurement of the SUS304 diaphragms using two wavelengths are presented.
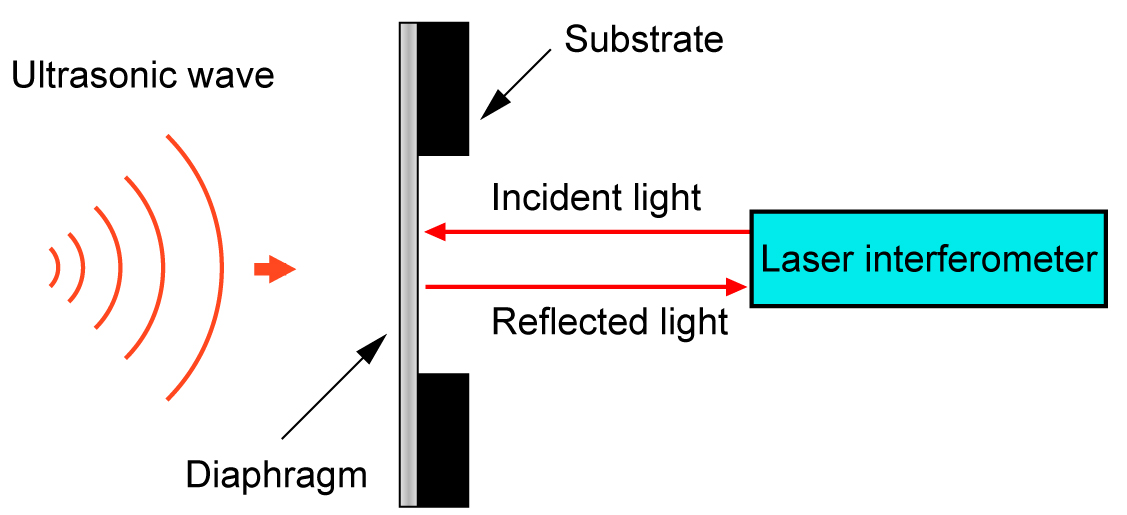
Fig.2. Schematic of an optical ultrasonic sensor.
2. Development Phase
3. Scope
- (1) Components:
Structural components inside the reactor vessel of fast reactors
- (2) Materials: Stainless steel (SUS304)
- (3) Location:Reactor vessel
- (4) Condition: Under-sodium environments at high temperatures around 200 degrees Celsius
4. Features
4.1 Waves induced on diaphragms
Shown in Fig. 3 are a schematic and a photograph of the diaphragms used to evaluate the sensitivity. The diaphragms were fabricated by bonding a piece of metallic foil on a substrate with circular apertures, which is also made of the same material as the foil, by means of diffusion bonding technique. The materials used are stainless steel (SUS304), titanium, and aluminum. The thicknesses of the foil t are 5, 10, and 20 μm for SUS304 and 10 μm for Ti and Al. The aperture sizes D are 3, 5, 7, and 10 mm, which define the diameter of the diaphragms. As shown in Fig. 4, the diaphragms are set on a sidewall of a water tank to have a direct contact with water on one side and with air on the other side, where water is used in place of molten sodium. A piezoelectric transducer (PZT) placed 30 cm away from the diaphragms transmits an ultrasonic pulse with a center frequency of 5 MHz. The center of the transducer is aligned with a line that passes through the center of the diaphragm to be examined, using a translation stage so that the diaphragm is subjected to a symmetrical pressure field of the incident ultrasonic pulse. We employed a heterodyne interferometer to detect the vibration induced on the diaphragm. The light source is a frequency-stabilized external cavity laser diode (ECLD), which emits linearly polarized light with a wavelength of 780 nm. The polarization axis of the light is rotated by a half-wave plate (HWP) to adjust the splitting ratio at the first polarizing beam splitter (PBS), where the light is divided into a reference beam and a probe beam. The reference beam is given a frequency shift of 80 MHz with an acousto-optic modulator (AOM)
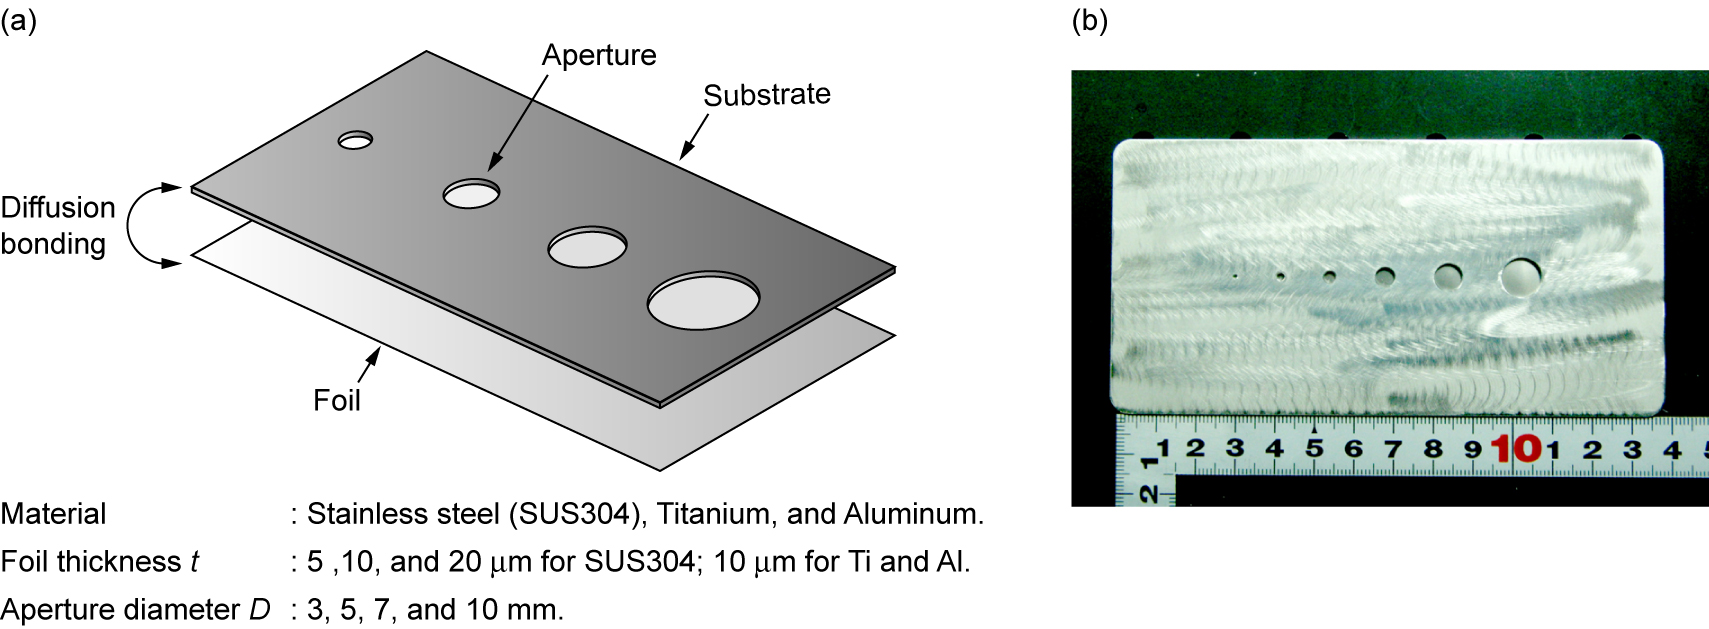
Fig. 3. (a) Schematic and (b) photograph of the diaphragms.
and then travels to a beam splitter (BS). The probe beam passing through the second PBS is coupled into a polarization maintaining fiber (PMF) and then focused on the diaphragm. After being reflected on the diaphragm, the probe beam travels the same path in the opposite direction and reaches the second PBS, where the probe beam is directed to the BS because the reflected light is vertically polarized due to passing through the quarter-wave plate (QWP) twice. The probe and the reference beams are recombined at the BS to produce an interference signal, which is then detected by a photodiode (PD). The output of the PD is a sinusoid oscillating at a frequency of 80 MHz with a time varying phase term, which is proportional to the amplitude of the vibration induced on the diaphragm by the incident ultrasonic pulse. The amplitude can be derived by means of in-phase/quadrature measurement of this sinusoidal signal using a phase demodulator.
In order to compare the waveform observed on the diaphragm, the ultrasonic pulse emitted from the transducer was measured using a needle hydrophone placed in the same position as the diaphragm. The result is shown in Fig. 5, where time is referenced to the trigger signal generated by the pulser. Several cycles of a 5 MHz wave with decreasing amplitude compose the whole pulse, whose duration is roughly 1.5 μs. The first cycle appears around 200 μs, which is consistent with the time that the ultrasonic pulse takes to propagate from the transducer to the hydrophone in water at room temperature.
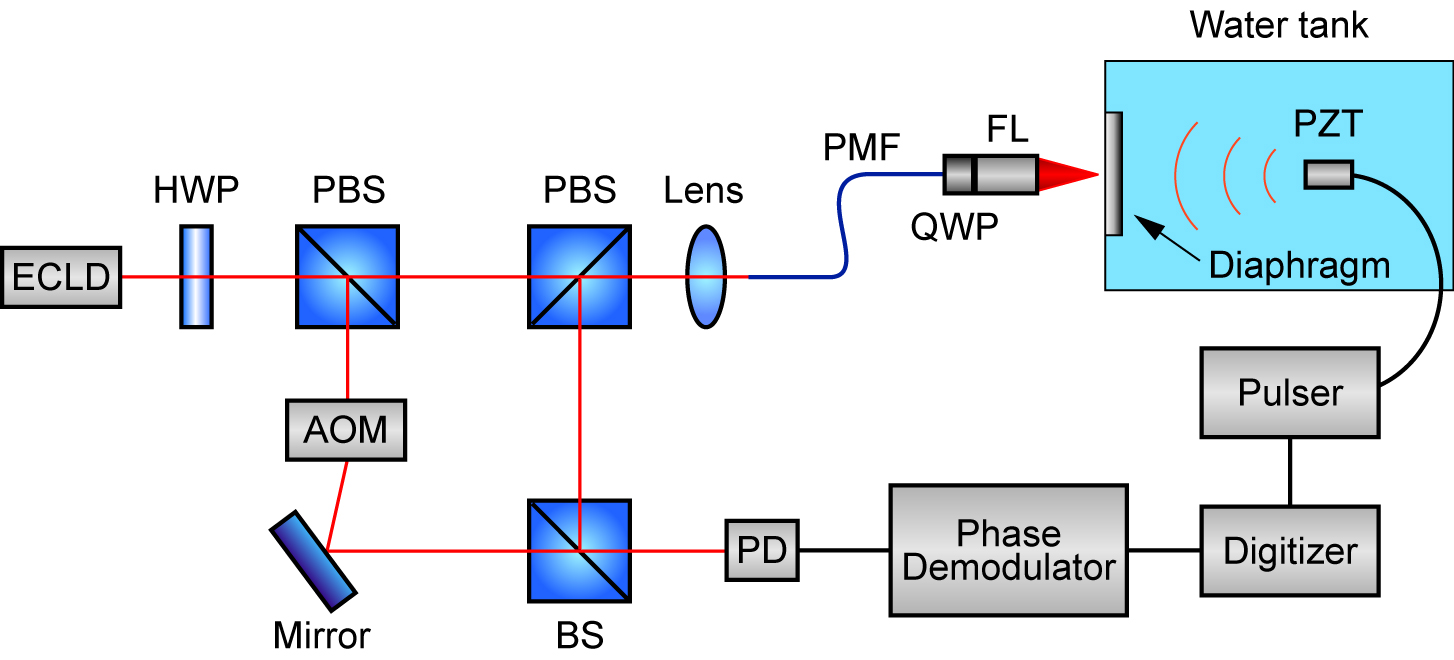
Fig. 4. Experimental setup used to examine the sensitivity of the diaphragms.
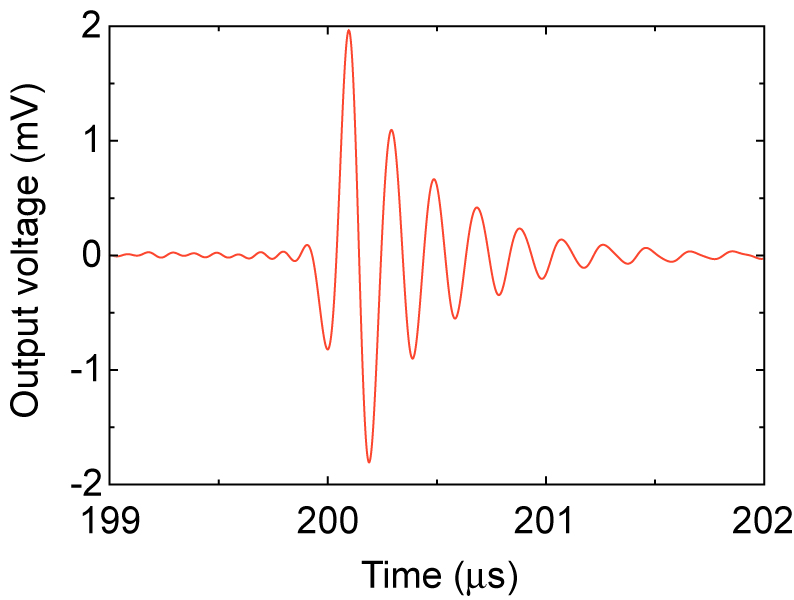
Fig. 5. Original ultrasonic pulse measured using a needle hydrophone.
The response of diaphragms to the incident ultrasonic pulse was examined using the SUS304 diaphragms. Figure 6 shows the waveforms detected at the center of the 10-mm-diameter diaphragms with thicknesses t of 5, 10, and 20 μm. There are two waves observed with a time delay. Compared with the original waveform measured by the hydrophone, it is evident that the first waves, which appear around 200 μs, are generated by the ultrasonic pulse that is directly incident on the diaphragms. We have confirmed that the first waves have almost the same waveform and amplitude over the surface of the diaphragms except for the region close to the edges, where the foils are bonded on the substrates, indicating that the first waves are generated in such a way that the diaphragms are translated in accordance with the pressure field of the incident ultrasonic pulse. The second waves, on the other hand, appear to be a lamb wave that travels over the surface of the diaphragms because the delay from the first waves are dependent on the thickness of the diaphragms; that is, the group velocity of the second waves is a function of diaphragm thickness. The amplitude of both waves increases with decreasing thickness. This can be explained as follows. Because of the same aperture size D = 10 mm, the diaphragms receive the same amount of energy from the ultrasonic pulse while the weight becomes lighter as the thickness decreases, meaning that the amount of energy per unit weight of the diaphragms increases with decreasing thickness. In addition to this, a decrease in the thickness also reduces the flexural rigidity of the diaphragms. These lead to an increase in the amplitude of the first and the second waves for thinner diaphragms.
Shown in Fig. 7 are the waveforms observed on the 5-μm-thickness diaphragms with diameters D of 3, 5, 7, and 10 mm. As is the case with Fig. 6, the second waves follow the first waves with a delay, but which is proportional to the diaphragm diameter, indicating that the second waves are emitted from the edge of the diaphragms. The amplitude of the first waves is independent of the diameter while that of the second waves increases as the diameter decreases. To describe the difference in behavior between the two waves, the lateral profile of the incident ultrasonic pulse was measured in front of the diaphragms, using a
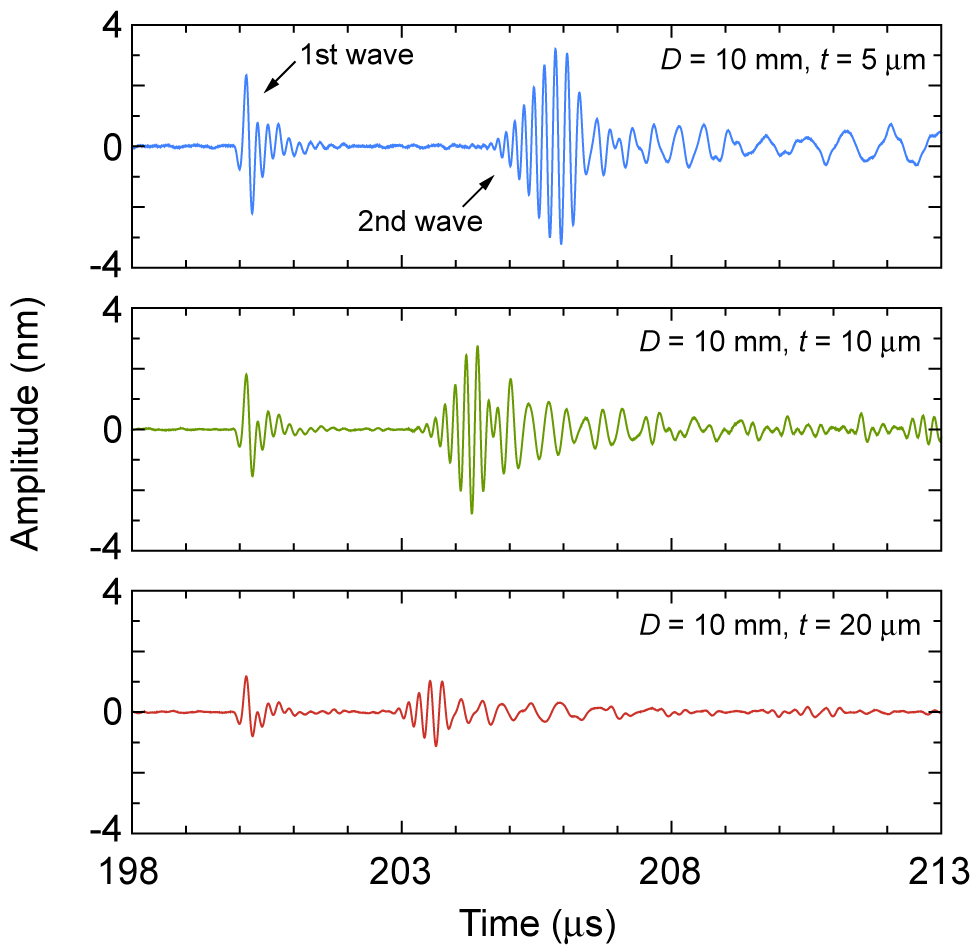
Fig.6. Dependence of the waveforms observed on the SUS304 diaphragms on the thickness.
needle hydrophone. The result shows that the pressure field of the incident ultrasonic pulse distributes almost uniformly around the central region of the diaphragms and gradually decreases toward the edge. Taking this pressure distribution into account, we can consider that the force applied to the diaphragms is proportional to the square of the diameter. The diaphragm weigh is also proportional to it. Hence, the force exerted on the diaphragms per unit weight becomes constant, and thus the first waves are independent of the diameter of the diaphragms. As opposed to the first waves, the second waves are strongly affected by the pressure distribution at the edge of the diaphragms, where the lamb wave is generated. Due to the pressure distribution mentioned above, the force exerted on the edge decreases as the diameter increases. Moreover, the second waves are attenuated with increasing distance from the edge because the kinetic energy of the second waves is dissipated into the water as well as absorbed by the diaphragms. For these reasons, the amplitude of the second waves decreases as the diameter increases. It is important to note that the amplitude of the second waves is larger than that of the first waves. This is because the lamb waves generated at every point on the circular edge of the diaphragms travel an equal distance to the center of the diaphragms and are therefore superimposed in phase. In other words, the large amplitude of the second waves results from the constructive interference of the lamb waves at the center of the diaphragms.
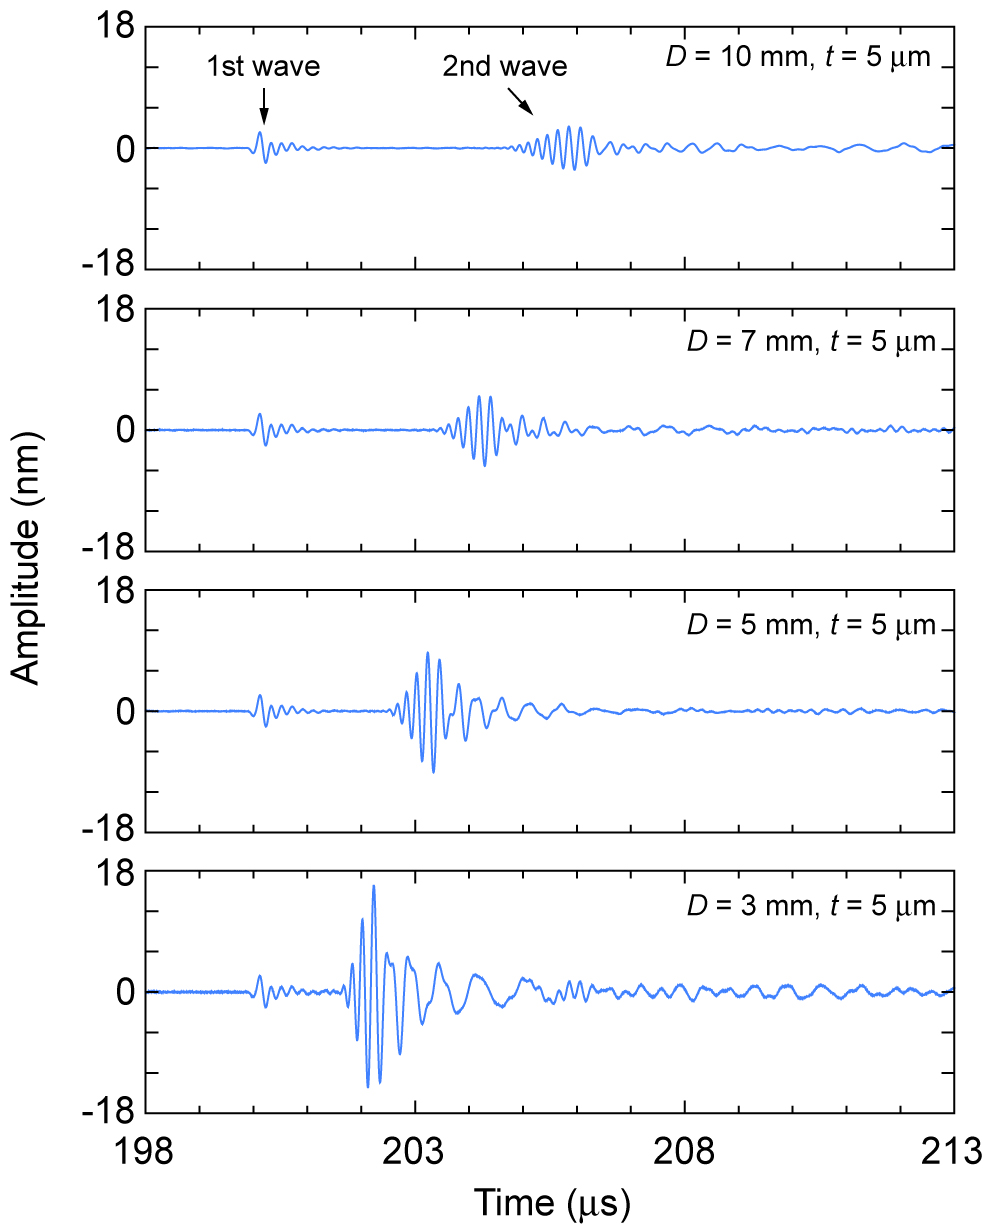
Fig.7. Dependence of the waveforms observed on the SUS304 diaphragms on the diameter.
4.2 Sensitivity characteristics
We have observed two waves, the first and second waves, induced on the diaphragms as a result of the incidence of an ultrasonic pulse. This means that the detection of the ultrasonic pulse can be done based on both waves, so the sensitivity of the diaphragms is evaluated for each case. For this purpose, the peak-to-peak amplitude of the first and second waves was examined as a function of applied acoustic pressure. Figure 8 (a) shows the result as to the first waves for the SUS304 diaphragms. The amplitude linearly increases in proportion to the applied pressure. Notice that the amplitude corresponding to each pressure level is not dependent on the diameter and determined solely by the thickness. By fitting the experimental data to a linear model, the sensitivities for the diaphragms with thicknesses t of 5, 10, and 20 μm are found to be 0.050, 0.036, and 0.021 nm/kPa, respectively. It is clear that the sensitivity can be improved by decreasing the thickness of the diaphragms. For the case of the second waves, the sensitivity depends on not only the thickness but also the diameter, as shown in Figs. 8(b)-(d). Thus, the sensitivity can be further improved by reducing the diameter in addition to the thickness when the second waves are employed for detection of the ultrasonic pulse. Indeed, the sensitivities for the 3-mm-diameter diaphragms with thicknesses of 5, 10, and 20 μm are 0.32, 0.18, and 0.14 nm/kPa, respectively, which are higher by a factor of approximately 5 to 6 than those obtained by use of the first waves.
Dependence of the sensitivity on the diaphragm material has been investigated by comparing the amplitude response obtained from the SUS304, Ti, and Al diaphragms. The diameter and thickness of these three diaphragms are 3 mm and 10 μm, respectively. As shown in Fig 9 (a), as to the first waves, the Al diaphragm has the highest sensitivity, 0.044 nm/kPa, followed by the Ti diaphragm, 0.040 nm/kPa, and then by the SUS304 diaphragm, 0.036 nm/kPa. This decreasing order of the sensitivity agrees with increasing order of the diaphragm weight. In other words, the sensitivity increases with decreasing density
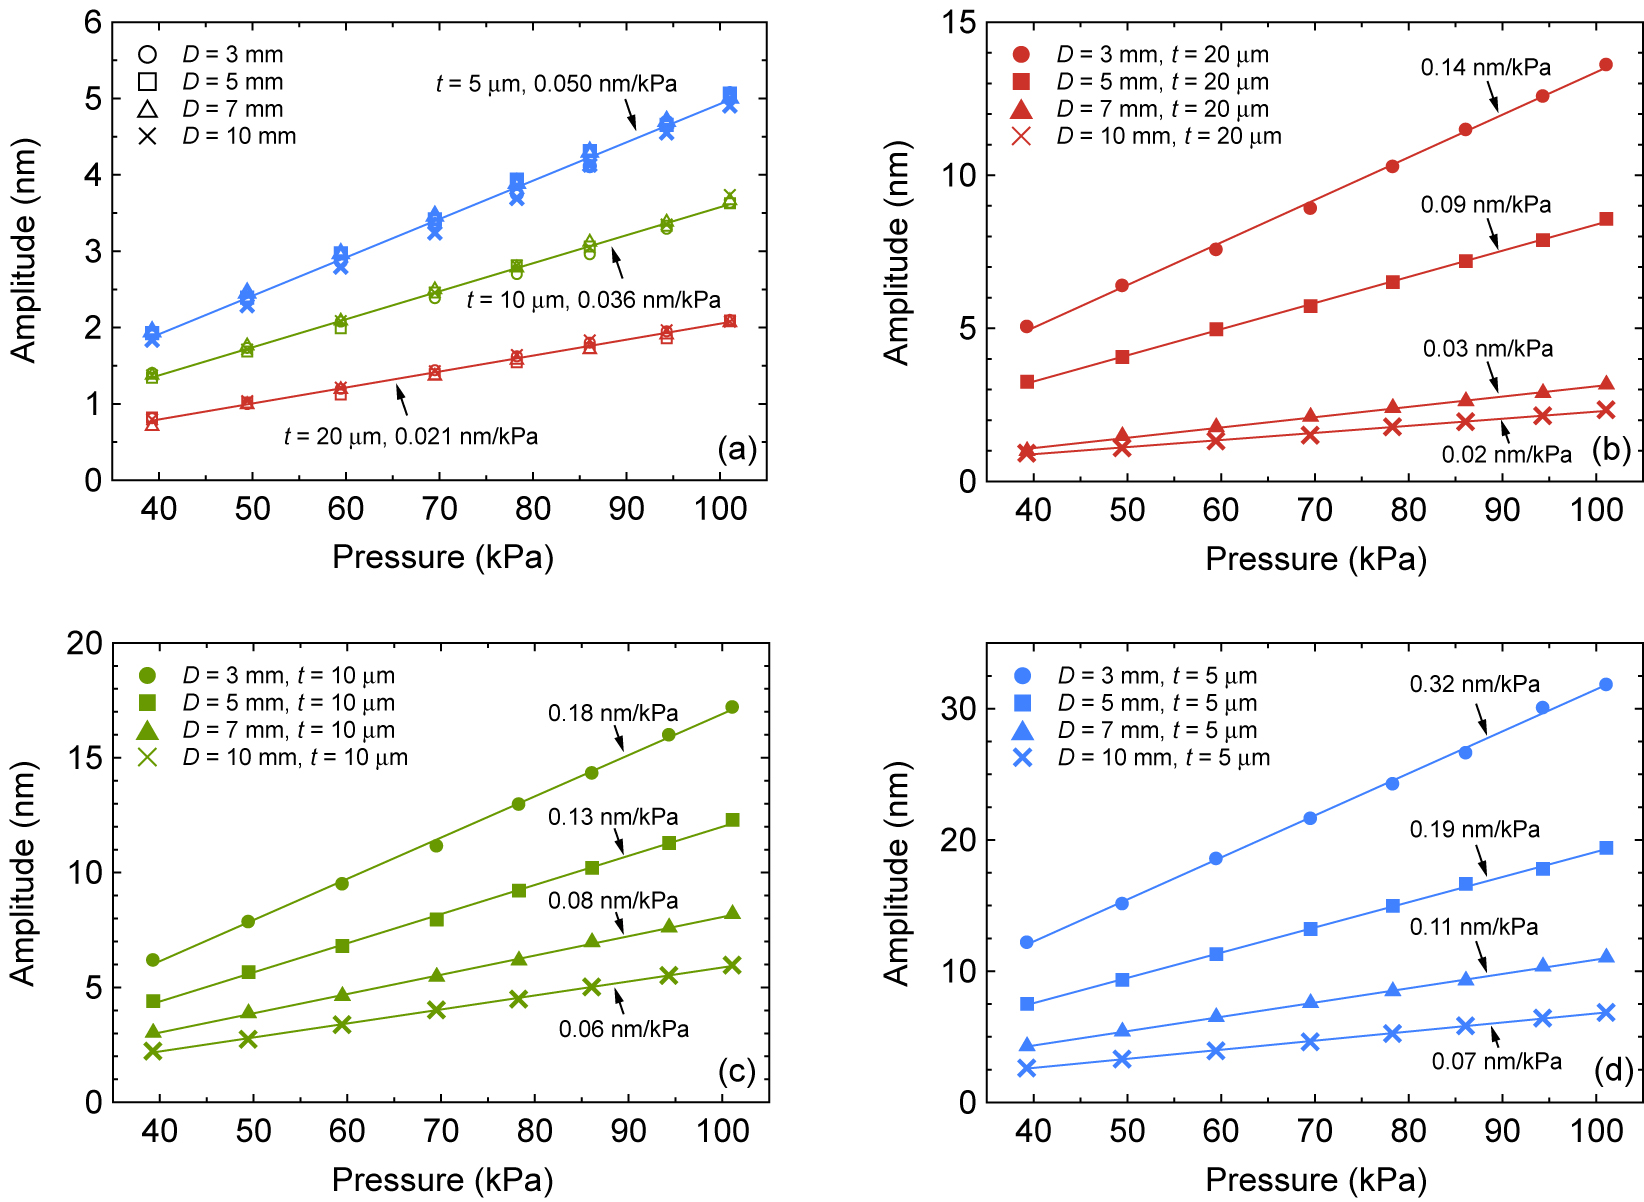
Fig.8. Relationships between the amplitude and the applied pressure for the SUS304 diaphragms for (a) the first waves and (b)-(d) the second waves.
of the diaphragm materials. Similarly, an improvement in sensitivity due to a reduction of the density can also be obtained in the case of the second waves, as shown in Fig. 9 (b). However, the Al diaphragm exhibits a lower sensitivity than the Ti diaphragm. This may be attributed to the defects caused in the fabrication of the Al diaphragm such as the circularity error of the aperture and the bonding strength between the foil and the substrate since it is considered that the second waves observed in these experiments are generated as a result of the interference of the lamb waves propagating from the edge of the diaphragms.
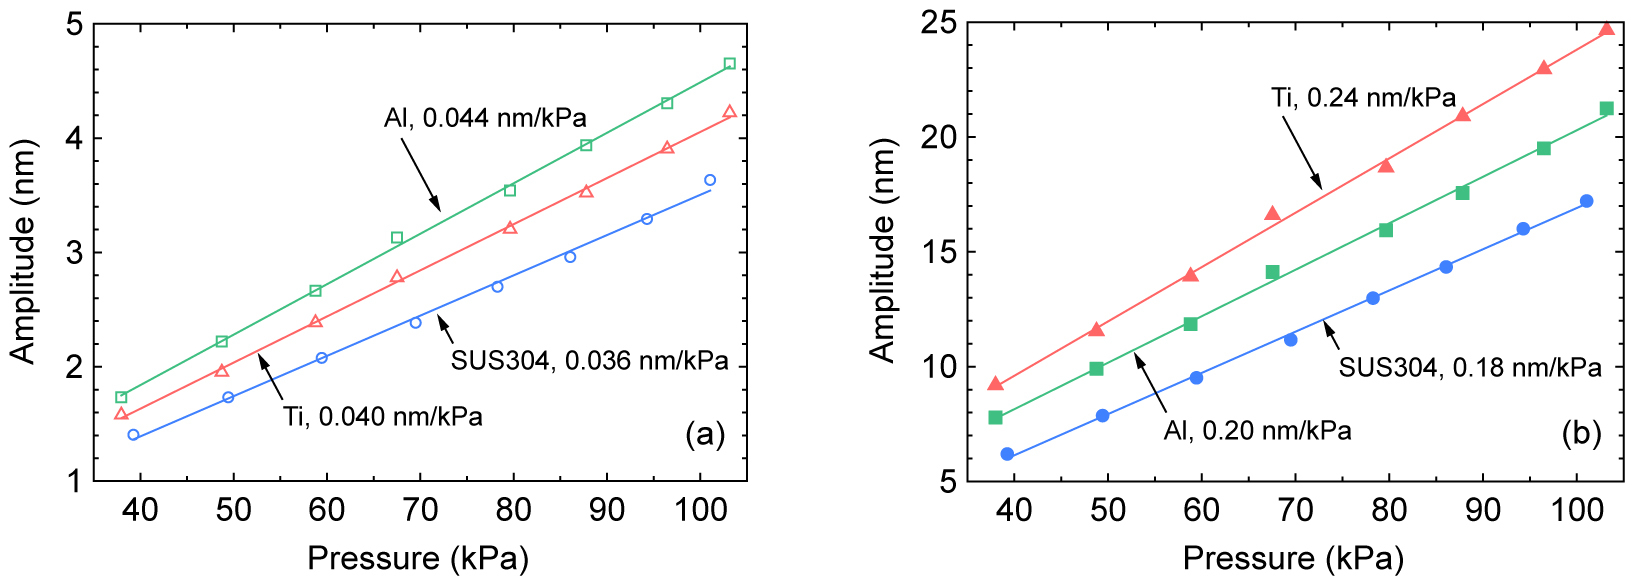
Fig. 9. Comparison of the sensitivities of the SUS304, Ti, and Al diaphragms for (a) the first waves and (b) the second waves. The diameter and thickness are 3 mm and 10 μm, respectively, for all three materials.
As described in Section 4.1, in a heterodyne interferometer, one of the two beams is frequency shifted by an acousto-optic modulator (AOM) to produce a sinusoidal interference signal oscillating at a given frequency. This interference signal serves as a carrier wave, on which an ultrasonic wave is modulated as a baseband signal. The carrier frequency is decided by the AOM drive frequency and therefore not affected by the frequency of the light source itself. This enables us to use multiple wavelengths in a single heterodyne interferometer to carry out the multiplexed measurement of diaphragms based on wavelength division multiplexing (WDM) technique, in which each diaphragm is assigned a unique wavelength and identified in the wavelength domain. In comparison with the sequential interrogation, which was employed in an optical sensor using a confocal Fabry-Perot interferometer [1], the interrogation time can be reduced by a factor of the number of wavelengths used. For instance, current WDM optical communication systems allow 160 wavelengths to be multiplexed in the C-band wavelength range. Accordingly, the interrogation time can be reduced by a factor of 160.
Figure 10 shows an all-fiber heterodyne interferometer used to demonstrate the multiplexed interrogation of two diaphragms based on WDM technique, where all the discrete optical elements in Fig. 4 are replaced with fiber-optic components used in optical communication systems. The light sources are two distributed feedback lasers (DFB1, DFB2) with wavelengths of λ1 = 1550.12 nm and λ2 = 1550.92 nm, which comply with the ITU-T 100 GHz frequency grid in the C-band wavelength range. The working principle of the all-fiber heterodyne interferometer is basically same as the free-space setup shown in Fig. 4 except that two wavelengths are multiplexed in the single interferometer using WDM couplers, and two diaphragms can be interrogated simultaneously with the wavelengths assigned individually to them. The interference signals corresponding to each diaphragm are detected separately by photodiodes (PD1, PD2) and demodulated to derive the waveform on each diaphragm.
The multiplexed measurement of diaphragms based on WDM technique has been conducted using the 5-μm-thick SUS304 diaphragms with diameters of 10 and 5 mm. The 10- and 5-mm-diameter diaphragms are interrogated simultaneously with the wavelengths of 1550.12 and 1550.92 nm, respectively. Figure 11 shows the response of each diaphragm to an ultrasonic pulse emitted from a piezoelectric transducer, which is located about 34 and 34.5 cm away from the 10- and 5-mm-diameter diaphragms, respectively. One can see that there is no apparent crosstalk between the waveforms detected on the two diaphragms. The first waves appear at different times, depending on the distance from each diaphragm to the transducer. From the figure, the time difference is found to be approximately 3.5 μs, which is in reasonable agreement with the value calculated based on a nominal sound speed of 1500 m/s and the difference between the distances from the transducer to each diaphragm, 3.3 μs. Note that the time difference between the second waves does not agree with that for the first waves. This is because the two diaphragms have different diameters.
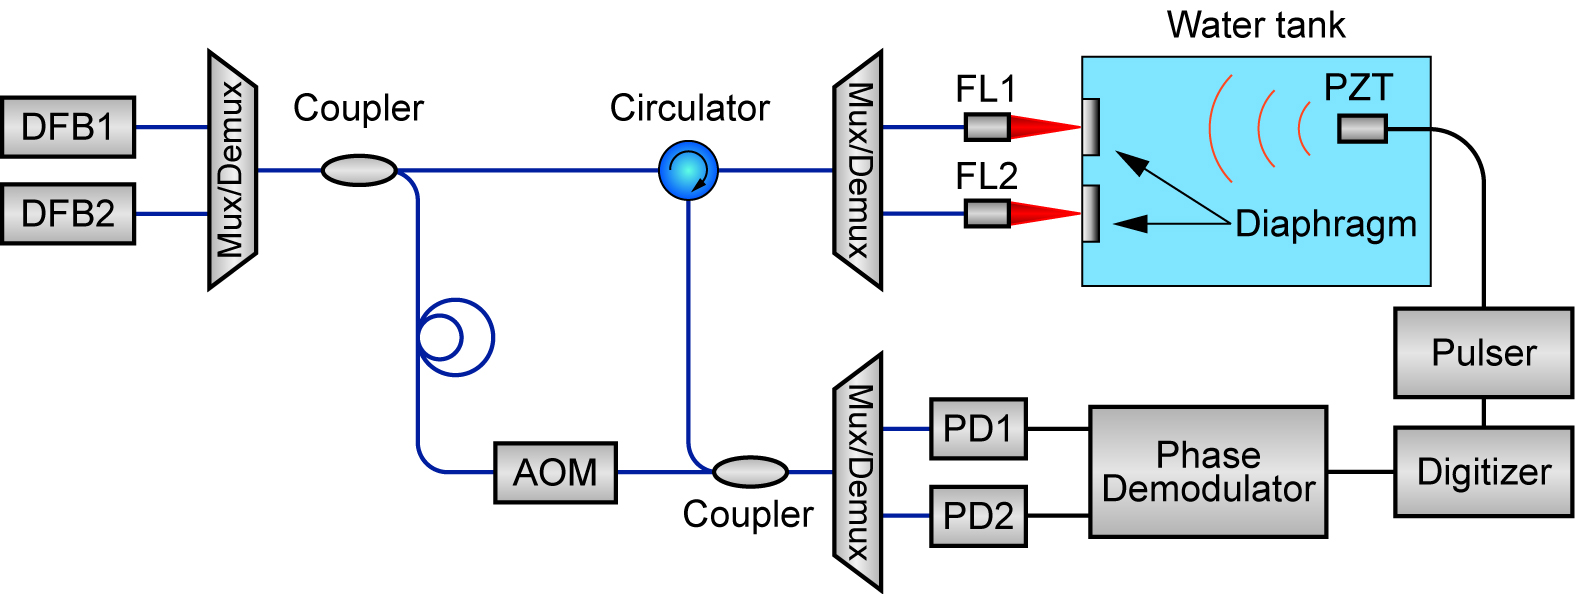
Fig. 10. Experimental setup for the multiplexed measurement of the SUS304 diaphragms based on WDM technique.
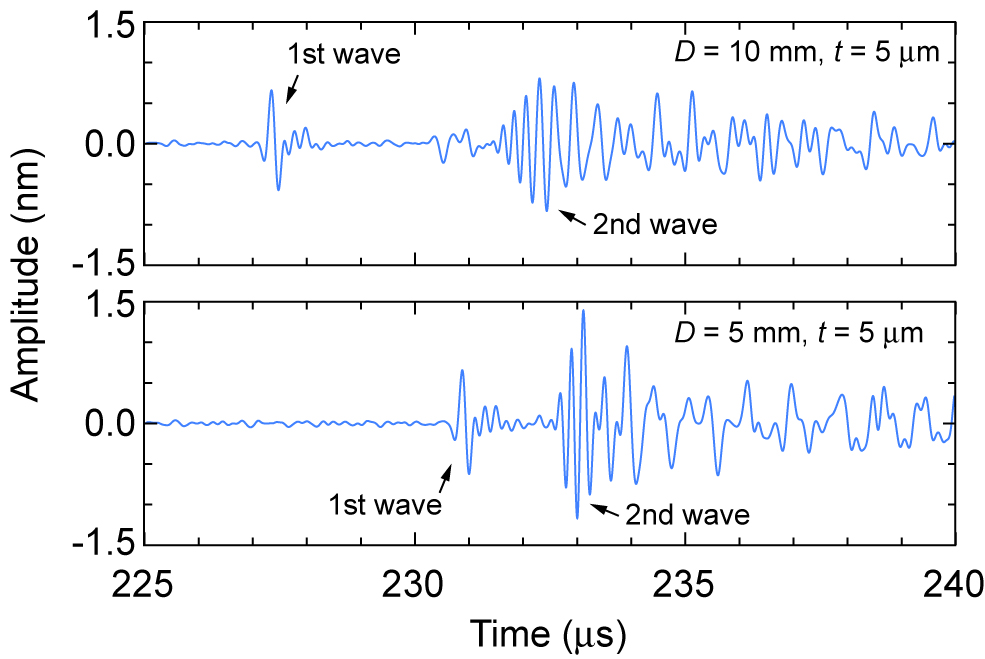
Fig. 11. Waveforms obtained from the multiplexed measurement of two SUS304 diaphragms.
5. Summary
We have experimentally examined the effects of the metallic diaphragms on the sensitivity characteristics of an optical ultrasonic sensor and investigated the multiplexed interrogation of the diaphragms based on WDM technique with a main purpose of a reduction in the interrogation time. The experimental results show that the sensitivity can be increased by use of thinner and lighter diaphragms. In addition, it has been found that by taking advantage of the interference of the lamb waves propagating through the diaphragms, the sensitivity can be further enhanced by a factor of approximately 5 to 6 with decreasing diameter. The multiplexed interrogation based on WDM technique has been demonstrated by simultaneously measuring two diaphragms using two wavelengths. From this experimental demonstration, we consider that the interrogation time can be significantly reduced by increasing the number of wavelengths.
In the next step experiments, we are planning to investigate the response of the diaphragms to an ultrasonic wave in molten sodium and the wetting behavior of the diaphragm materials. Computer simulations of the waves induced on the diaphragms will also be conducted to theoretically analyze the experimental results obtained in this paper and study an optimized design of the optical ultrasonic sensor for under-sodium visual inspection.
6. Reference
- [1]A. Tagawa and T. Yamashita, “Experimental results on high resolution sensor elements by optical method for under sodium viewer (2),” 2008 Fall Meeting of the Atomic Energy Society of Japan, B31 (2008) (in Japanese).
- [2]M. Takeishi, K. Shibaike, T. Ito, H. Yanagida, M. Tamura, and S. Fujimori, “Development of multiple ultrasonic transducer by optical method for under sodium viewer,” Proceedings of 6th International Conference on Nuclear Engineering, ICONE6-6115 (1998).
- [3] H. Kawahara, M. Izumi, T. Suzuki, S. Nagai, M. Tamura, and S. Fujimori, “Development of under-sodium three-dimensional visual inspection technique using matrix-arrayed ultrasonic transducer,” Journal of Nuclear Science and Technology, Vol. 37, No. 9, pp. 769-779 (2000).
- [4] A. Tagawa and T. Yamashita, “Development of real time sensor for under sodium viewer,” Proceedings of 19th International Conference on Nuclear Engineering, ICONE19-43187 (2011).
- [5]R. Mezrich, D. Vilkomerson, and K. Etzold, “Ultrasonic waves: their interferometric measurement and display,” Applied Optics, Vol. 15, No. 6, pp. 1499-1505 (1976).
7. Contact
Japan Society of Maintenology (ejam@jsm.or.jp)